New home permits in Gloucester County
are running behind last year.
Census Bureau figures show 326 single family permits authorized in Gloucester County through July, against 516 over the same months in 2025. Here is where the other seven South Jersey counties landed.
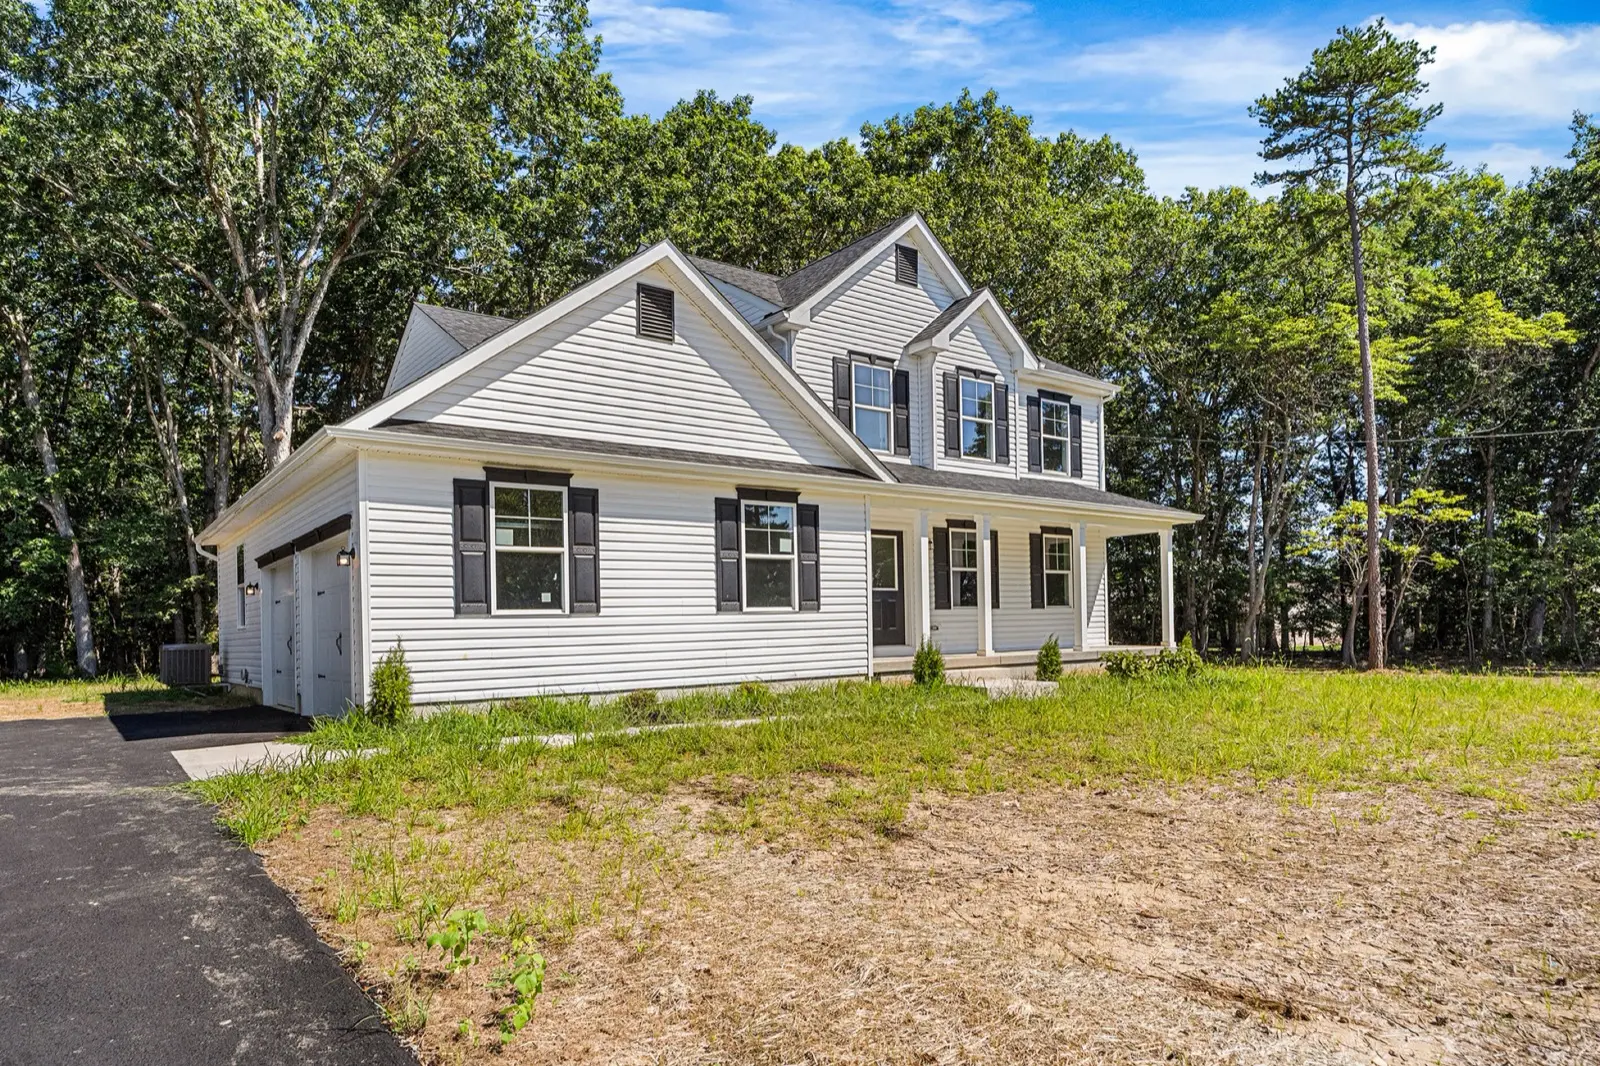
- Gloucester County authorized 326 single family housing permits from January through July 2026, against 516 over the same seven months of 2025, according to the U.S. Census Bureau's Building Permits Survey
- Across the eight South Jersey counties, the January to July single family totals were Ocean 966, Burlington 752, Cape May 378, Gloucester 326, Atlantic 298, Camden 264, Cumberland 92 and Salem 44
- A permit means a builder can start the house. It does not mean the house is finished or sold
Written by Justin Kelly, Real Estate Broker-Associate, from the U.S. Census Bureau Building Permits Survey.
Every month the U.S. Census Bureau publishes how many new housing units local permit offices around the country authorized, county by county. It is one of the plainest measures of how much new construction is actually coming, and for Gloucester County the 2026 reading is a good deal lighter than last year's. Through the first seven months of the year the county authorized 326 single family permits. Over the same January to July stretch of 2025 it authorized 516.
The rest of South Jersey, on the same single family measure and the same seven months of 2026: Ocean County 966, Burlington County 752, Cape May County 378, Gloucester County 326, Atlantic County 298, Camden County 264, Cumberland County 92 and Salem County 44. July by itself was Burlington 90, Ocean 89, Atlantic 56, Gloucester 55, Cape May 45, Camden 27, Cumberland 10 and Salem 7. The figures on this page run through July 2026.
A building permit is a local government's authorization to begin construction on a specific property. It is not a sale, it is not a finished house, and it is not a guarantee that anything gets built on the schedule anyone has in mind. Some permitted homes go up in a few months, some sit. The survey also counts permits rather than groundbreakings, so the figures above describe what has been allowed to start, not what has started.
One more caveat applies to any county number from this survey. The published county totals include Census estimates for towns that issue permits but did not file a report in a given month, so a county's change from last year can partly reflect which towns reported rather than how much was built. The Bureau also lists the permits towns actually reported. In Gloucester County the published count fell from 516 to 326 permits and the reported count fell from 417 to 272, so the drop shows up either way. In Burlington and Camden counties the two counts did not agree, which is why this page compares only Gloucester County with last year.
If you are weighing new construction in Gloucester County, we can help you compare what is under construction now against your budget and timeline.
Our take
Permits are the earliest read on how much new construction is coming, and a lighter year usually means fewer homes reaching the market later on. If you are weighing new construction in Gloucester County, that shapes what you will have to choose from.
Thinking about new construction in Gloucester County? Let's talk.
Want our South Jersey news in your Google results?
Add The JK Realty Group as a preferred source on GoogleFigures are permits authorized, not housing starts, sales or completions. County totals include Census estimates for permit-issuing places that did not report in a given month. General information, not advice about any specific property. The JK Realty Group, brokered with OMNI Real Estate Professionals. Equal Housing Opportunity. See our Terms of Use for how we source and credit these posts.
Related Posts
What is a pre-listing inspection?
Explainer
375 apartments open at the Moorestown Mall
Reported by Patch
Moorestown, NJ · photo Tinton5, CC BY-SA 3.0